Codex Alimentarius Commission guidance promotes a harmonised risk assessment approach to precautionary allergen labelling to improve consumer confidence and provide greater clarity for food businesses.
An estimated 4.3% of the global population are affected by food allergies with reactions ranging from mild symptoms to life-threatening anaphylaxis1.
While the labelling of intentionally added allergen ingredients is mandated in regulations, the procedure for “may contains” statements covering the unintentional presence of allergens varies widely and remains unregulated in many parts of the world.
As a result, it can be difficult for consumers to judge the actual level of risk and some may unnecessarily avoid foods that are safe or lose confidence in the warnings and simply ignore them.
The unintended presence of food allergens or cross-contamination can occur during food production, even when the allergen is not an ingredient. For example, a cereal bar without nuts produced on the same line as nut-containing products may still contain traces of nuts despite cleaning procedures.
Allergens may also be transferred during ingredient handling and storage and therefore precautionary allergen labelling (PAL), including statements such as “may contain”, is often used to alert consumers to potential residual risks.
However, guidance is needed to prevent unnecessary PAL by ensuring warnings are only used when the risk has been scientifically assessed and cannot be adequately controlled through good allergen management practices.

The new Codex guidance recommends a qualitative risk assessment which can be supplemented with a quantitative risk assessment of unintended food allergen presence.
Reference doses for individual allergens are also included in the guidance and serve as the basis for establishing action levels.
The intention is that PAL shall only be used when, following the application of appropriate measures, the unintended presence of a food allergen(s) is above the action level for the allergenic food based on the reference doses for IgE-mediated food allergy and for coeliac disease.
PAL should not be used when the unintended presence of a food allergen(s) is at or below the action level.
The guidance also includes other points of clarification as for example, how to label in the case where the unintentional source of the gluten cannot be verified by risk assessment and how and where the PAL should appear on label.
The guidelines were adopted as part of the 49th Session of the Codex Alimentarius Commission2, held in Geneva, Switzerland, from 6 to 10 July 2026 and will be included as an annex to CCFL’s General Standard for the Labelling of Pre-packaged Foods (CXS 1-1985)3.
The guidance complements existing Codex standards on allergen declaration and food allergen management, including the Code of Practice on Food Allergen Management for Food Business Operators (CXC 80-2020)4.
While Codex guidance is voluntary, it often serves as an internationally recognised benchmark that supports national legislation and assists international trade.
Currently the European Commission5 is considering the adoption of harmonised requirements for the use of voluntary PAL statements and the UK are also exploring options6.
Notes: Established by FAO and WHO, the Codex Alimentarius Commission develops international food standards, guidelines and codes of practice to protect consumer health and promote fair practices in the food trade.
Initiatives to lower the sodium content in the food supply come in the form of mandatory or voluntary targets, which are a critical step to reducing dietary sodium intakes1.
As the world focuses more on sustainable diets, we can expect dietary sodium intake targets to become more important and prevalent in the coming years. In this article, we review:
-
- Sodium’s role in health
- Tax and legislation initiatives on sodium reduction being enacted globally and their impact
- Voluntary initiatives from food industry and impact on sodium intake
- What to expect in the future
What are the Effects of Excess Sodium Intake on Health?
Cardiovascular diseases (CVD) account for most non-communicable deaths (NCDs) globally1, which equates to 17.9 million people annually2.
Of these deaths, an estimated 1.89 million each year is associated with excessive intake of sodium in Europe3, which is a major driver of high blood pressure in many countries4, which is the leading risk factor for CVD5,6.
Salt is the main source of sodium in foods7, therefore reducing salt intake can naturally translate into a lower sodium intake, which is beneficial for health4,8 and is associated with reduced cardiovascular events1.
However, sodium isn’t all bad! The human body requires a small amount of sodium for critical body function such as muscle contraction and relaxation, conduction of nerve impulses, and regulation of body fluids7.
Unfortunately, our intake far exceeds the amount required by the human body and, hence, has a negative impact on health3.
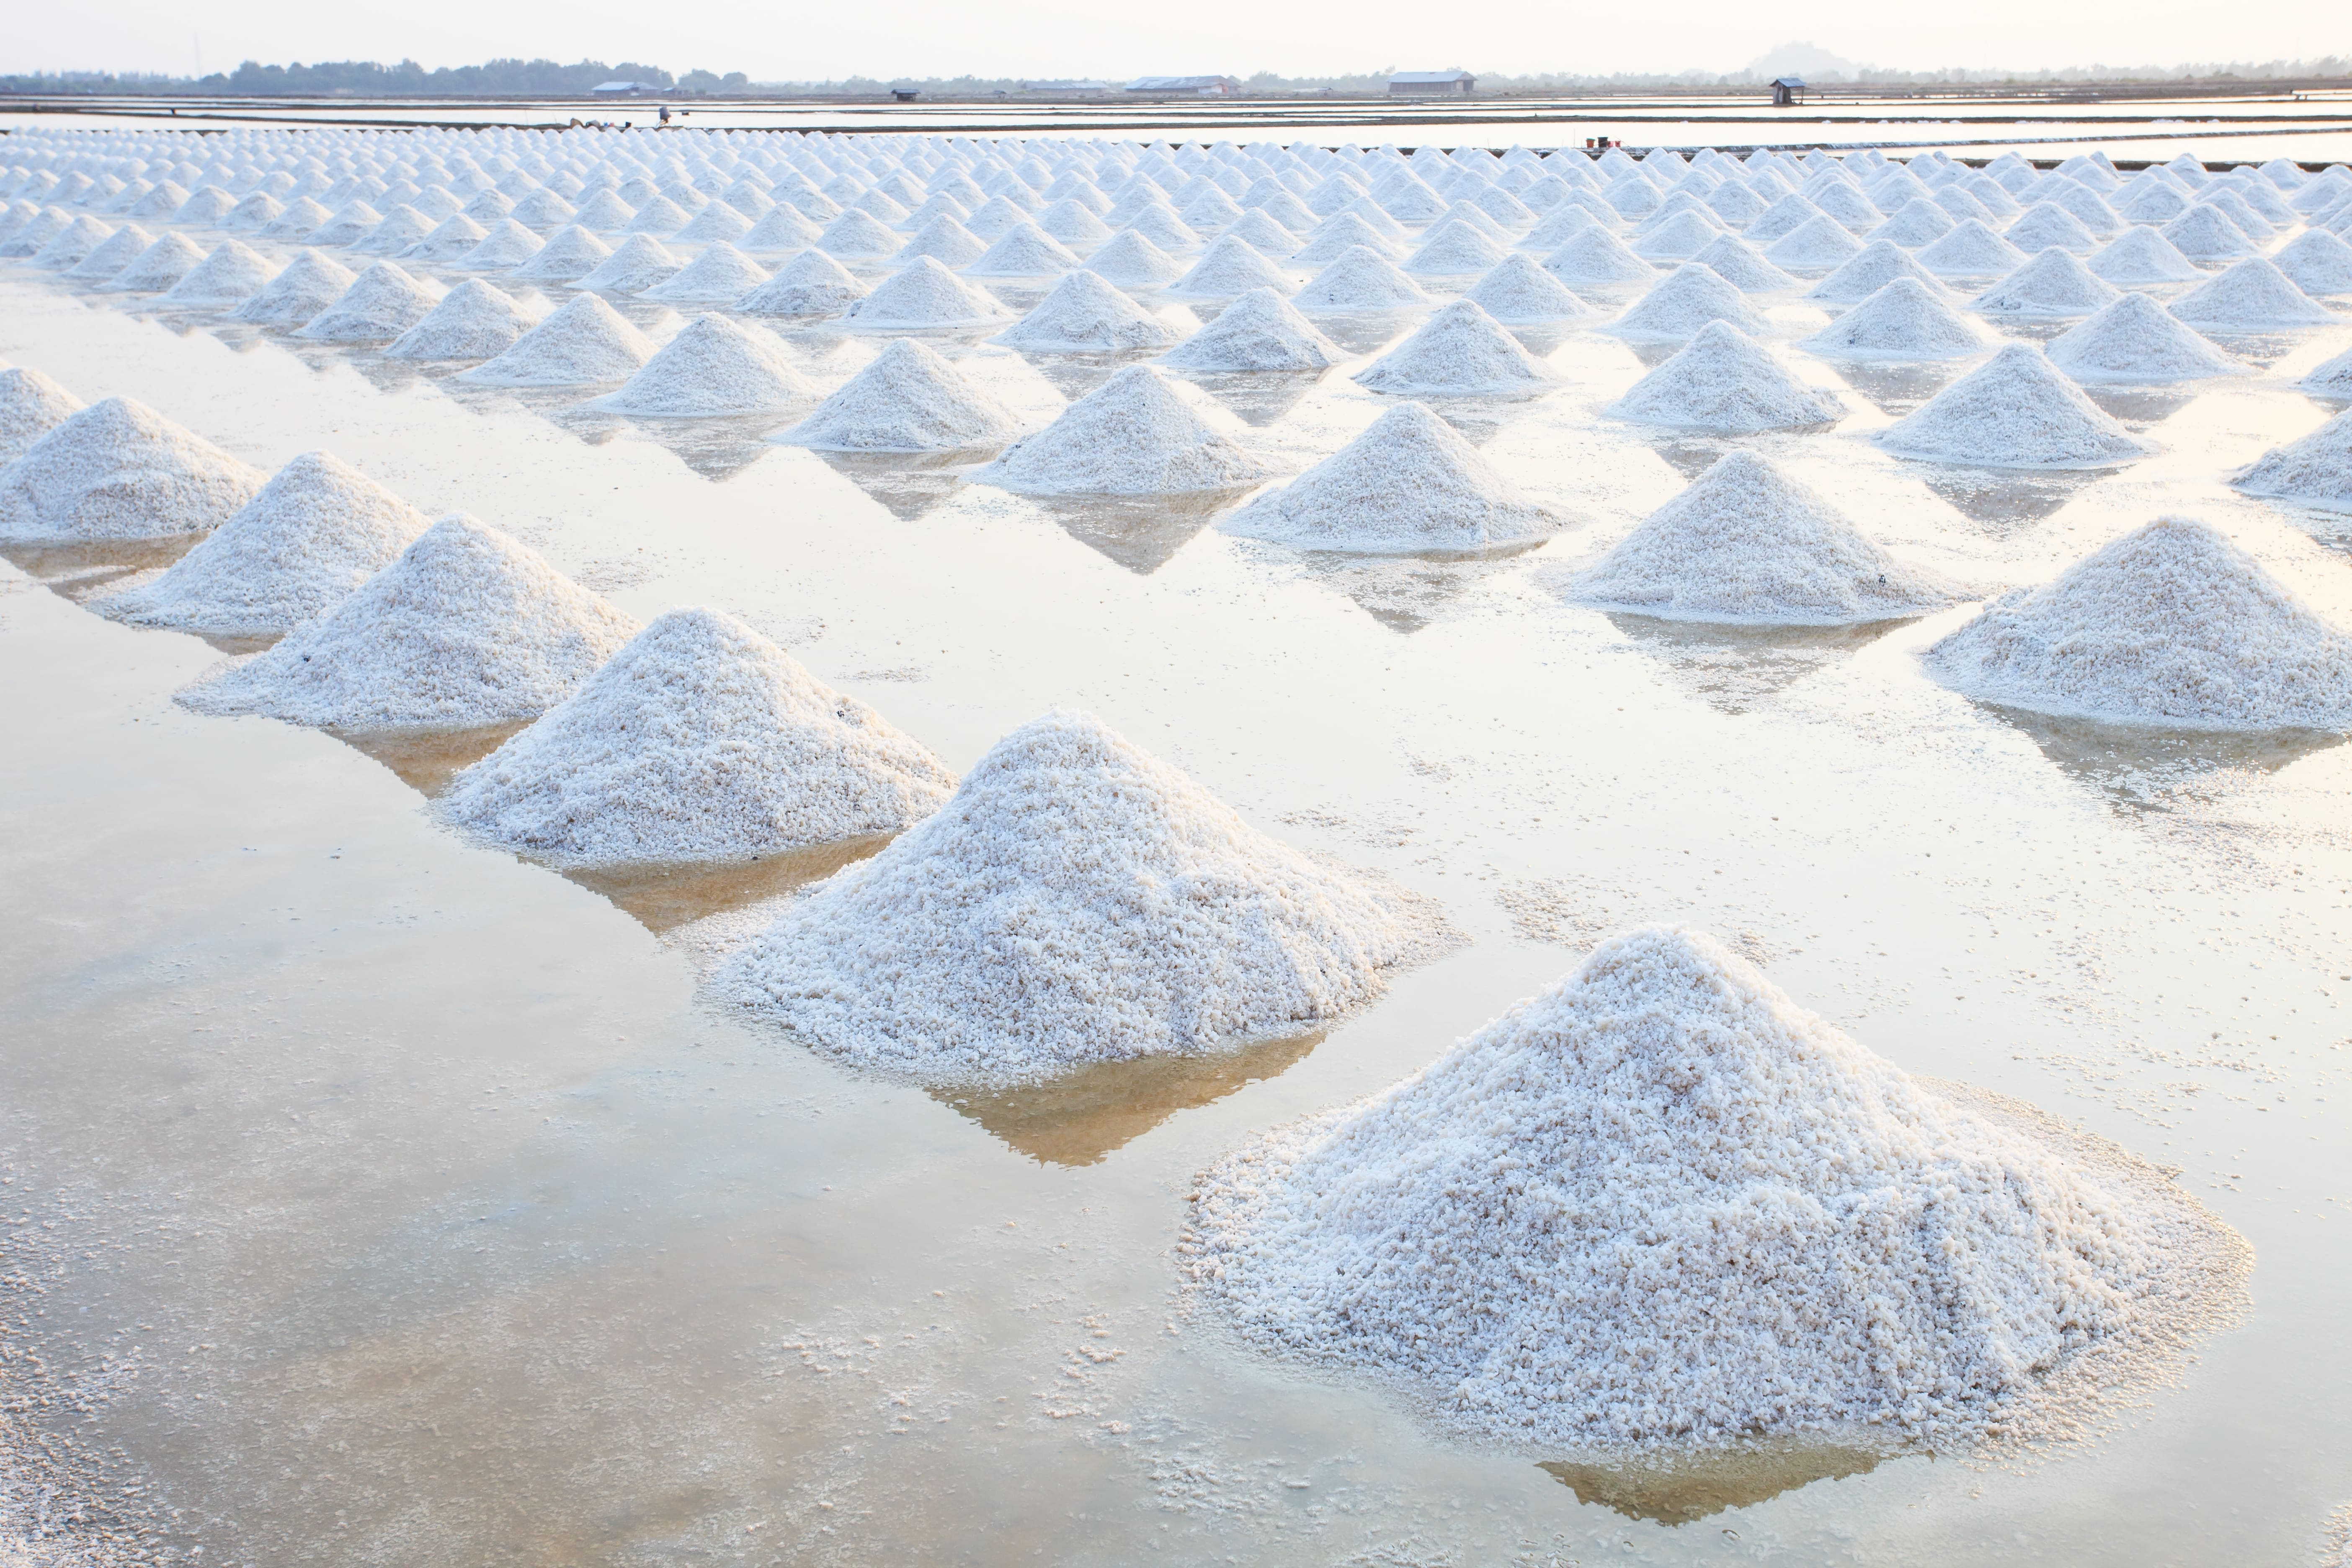
The global average dietary sodium intake in adults is 4,310mg per day (10.78g salt per day), which is more than double the recommendation advised by World Health Organisation (WHO) (2000mg sodium/day = 5g salt per day)9,10.
In general, daily sodium intake targets range between 2,000mg and 2,400mg per day (5 – 6g) across the globe9,11-13. Alarmingly, reports from international organisations reveal that the Middle East has extremely high rates of salt consumption, with an average per capita consumption of more than 12g per day14.
According to the UK National Diet & Nutrition Survey (NDNS), the main contributors of dietary salt are bread, cheese and processed meat products15.
This is similar for Europe, with a large proportion of salt intake coming from foods that don’t necessarily taste salty such as potato products and tinned produce16.
On the other hand, sources of dietary sodium have been shown to differ between high-income countries (HICs) and low- and middle-income countries (LMICs)17. For instance, in Southeast Asia, manufactured and processed foods provide 80% of the dietary salt intake in HICs, whereas most of the consumed salt in LMICs is added during food preparation and cooking and/or discretionary table salt17,18.
It is important to bear in mind that, in general, consumption of processed foods is still relatively low in South Asian countries. A study conducted in South India identified key food sources of sodium were pulses (29.7%), rice-based dishes (27%) and vegetables (16.7%)19.
What Actions are Being Taken to Lower Sodium Intakes?
Implementing highly cost-effective sodium reduction initiatives could potentially save an estimated seven million lives globally by 203020.
Many countries have implemented salt reduction targets for commonly consumed foods as part of a strategy to reduce salt intakes. In 2013, the WHO Member States adopted a voluntary global target of 30% reduction in mean population salt intake by 202521.
Although there has been an increase in the number of salt reduction initiatives around the world since 201422, efforts must be urgently accelerated and replicated in other countries, with more rigorous monitoring and evaluation of strategies needed to achieve salt reduction targets.
Table 1. National sodium/salt reduction initiatives by WHO region22
South-East Asia: To align with the WHO global sodium reduction target, in 2013, the WHO South-East Asia countries set an intermediate regional target of 10% reduction in mean salt intake over the next 5 years10.
Europe & UK: Many countries in Europe either have mandatory and/or voluntary salt reduction initiatives such as maximum permitted salt levels in foods and reformulation programs.
Policies include strategies such as taxes on high-salt food (Hungary), mandatory high-salt content labels (Finland) and targets for reformulation and close monitoring of the food supply (UK)23.
Eastern Mediterranean: The Eastern Mediterranean Region, which includes 22 countries and a population of approximately 580 million people, is a region that has a high burden of CVD17,24.
National sodium/salt reduction strategies have been identified in Bahrain, Egypt, Iran, Jordan, Saudi Arabia, Kuwait, Lebanon, Morocco, Oman, Palestine, Qatar, Tunisia and the UAE17.
The least common initiative was taxation on foods and beverages, whereas the most common strategy was reformulation (100%), followed by consumer education (77%), initiatives in specific settings (54%) and front of pack labelling (46%). However, only 27% of Eastern Mediterranean countries monitored activities and impact evaluations are lacking24.
Taxes and Legislation
Taxing high salt products – Case Study in Europe
In 2011, Hungary implemented a tax called Public Health Product Tax (PHPT) on packaged foods that contain high levels of salt such as salty snacks and condiments.
The aim of introducing taxes is to reduce the consumption of food products that are not beneficial to public health25. However, it is not easy to prove causality between the implementation of a nutrient tax and a reduction in consumption of that specific nutrient.
For Hungary, an evaluation was conducted after the introduction of the PHPT to monitor its impact on the population.
Unfortunately, the consumption of taxed products by the adult population did not decrease, thus the salt tax had a minimal impact on Hungarian consumers behaviours26.
Establishing mandatory upper limits on salt content of foods
Americas: On December 6, 2023, the Ministry of Health of Colombia issued Resolution 2056 which amended their “sodium rule”.
This amendment allows US exporters to use self-declarations to certify compliance with Colombia’s maximum sodium levels in processed products, which will help facilitate the trade of processed products to Colombia27.
Europe & UK: European countries, including Belgium, Bulgaria, France, Greece, Netherlands and Portugal, have implemented mandatory maximum salt targets on products with a generally high salt content.
The main products of focus are those that significantly contribute to dietary sodium intakes.
The UK is often viewed by other countries as a good example for addressing an issue in public health28. It implemented a successful voluntary salt reduction initiative and now the government legislated to restrict the promotion, location and advertising of products deemed high in fat, sugar and/or salt (HFSS)29.
Warning labels on high salt foods
Across the globe, many countries use front of pack nutrition labels or warning labels that highlight the content of energy and usually these four nutrients – fat, saturated fat, sugar and salt in foods and beverages.
It is widely accepted that one of the most effective ways to reduce sodium intake at a population level is through lowering the sodium content of foods that are consumed frequently.
Engaging industry on a voluntary basis to reformulate products high in salt is a key strategy to achieve success23. Many countries have established voluntary industry-led initiatives with category-specific salt targets for a wide range of food products.
Europe & UK: European food industry and retailers show Reference Intakes (RI) on the front of product packaging, where the content of the above mentioned are displayed along with the daily RI for energy and for the four nutrients per portion30. In addition, the energy value is also expressed per 100g/100ml.
In recent years many countries have adopted similar front-of-pack labels displaying information on sodium (or salt). For instance, in mainland Europe, several countries have implemented the Nutri-Score labelling scheme which grades the nutritional value of foods from A to E30. From January 2026, companies using the Nutri-Score logo must adopt the latest and more restrictive, Nutri-Score algorithms for food and beverages31.
In Finland, numerous activities have been undertaken to reduce salt, in particular voluntary initiatives and compulsory front-of-pack warning labels. Warning labels are required if a specific product contains sugar or salt above a defined threshold. For example, foods that are high in salt are required to carry a “high salt content” warning32. Interestingly, since their introduction, the average sodium content in food products in Finland has decreased by 20-25%32.
Americas and Canada: Many countries in Latin America such as Chile, Mexico, Peru, Uruguay and soon Brazil, have adopted front-of-pack black warning labels that indicate if a product is high in calories, fat, sugar and salt30,33 (Figure 1).
In October 2021, the US Food and Drug Administration published new voluntary sodium reduction goals for the food and beverage industry34. Due to pressures to reduce sodium intake, the targets are only for 2.5 years compared with those issued previously.
The strategy supports sodium reduction already achieved by industry, provides targets for defining and measuring progress and provides companies with the flexibility and time to meet these targets.
In Canada, as of January 2026, a front-of-package nutrition symbol is mandatory for pre-packaged foods that meet or exceed set levels for saturated fat, sugars or sodium.
South-East Asia: In most South Asian countries, salt reduction initiatives are still in the planning phase and are yet to be fully implemented, with outcomes not evaluated or reported10.
Scaling up community-wide salt reduction strategies in this region is imperative for reducing salt intakes.
From a public health perspective, voluntary industry initiatives can be more effective, as they may be more achievable than government measures which can be hampered by pressure from interest groups, political gridlock and bureaucratic inertia.
They may also achieve public health objectives quicker, more efficiently and less intrusively than governmental regulation.
An Industry Perspective
There are many positives with engaging in nutritional improvement of products, such as public health responsibility, creating positive publicity for the brand, goodwill among stakeholders and preventing binding government regulation and fiscal measures.
Product reformulation has large potential effects on the quality of the diet and has the potential to improve population health16.
One primary hurdle is that reformulation can alter the sensory attributes of food products and influence consumer liking.
However, there is evidence that consumers do not detect gradual decreases in the salt content of foods when slowly reduced over time35.
Examples of successful industry-government partnerships for salt reduction
Community-based salt reduction programs have been conducted in many parts of the world, resulting in reduced salt intake, increased awareness and lowering of BP10.
Of all the WHO 194 Member States, 79% (154) have committed a policy towards sodium reduction and these commitments are usually included in national nutrition plans (n = 82), non-communicable disease plans (n = 94) or health sector plans (n = 40)6.
Western Pacific: A community-based Eat Less Salt intervention in Vietnam decreased community salt intake from 21.5 to 20.4 g per day together with reduction in both systolic and diastolic blood pressure between baseline and follow-up of 1-year intervention10.
A similar project in Australia demonstrated a mean salt intake reduction from 8.8 to 8 g per day over a 3-year period.
A study in Japan found significant reduction in community salt intake and a corresponding reduction in BP10.
Europe & UK: Similarly, a research study conducted in Portugal reported a significant reduction in community salt intake and a corresponding reduction in BP10.
Many EU governments in countries including Austria, Belgium, Czech Republic, France, Greece, Italy, Netherlands and Spain have proposed a collaborative approach with industries on setting voluntary salt targets.
In Ireland, a salt reduction program was run over ten years from 2003 to 2013 which led to a reduction in daily adult salt intake by 1.1g36. In 2021, the Irish Government published their ambitious ‘Reformulation Roadmap’ with 2025 targets for reducing calories (20%), saturated fat (10%), salt (10%) and sugar (20%) in products that contribute to the most intake of these nutrients37.
The UK’s gradual salt reduction program has been successful in reducing population-level salt intake: it achieved an overall reduced salt intake of 1 g per day in the adult population, reducing adult average sodium intake from 3,752 mg per day (9.38 g per day) in 2000 to 3,352 (8.38 g per day) in 201838. This is a great step forward for public health despite the intake still being considerably higher than the UK recommended intake of 2,400g per day.
Conclusion
Many countries have taken and will continue to take actions to reduce population sodium intake.
High sodium intake is associated with not only increased BP but also risk of CVD. Global sodium consumption is too high, so reducing intake will significantly improve public health.
For this reason, the sodium levels in products will continue to be scrutinised and the pressure on industry to reformulate products will continually increase.
The role of salt is essential in the preservation, flavour and structure of food products; therefore, it is essential that governments and food industry collaborate to educate consumers, invest in new technologies and develop innovative reformulation methods and practices.
This article was originally published on 13 October 2021. It is being currently updated January 2026.
This blog is one of a 5-part series covering key topics of discussion during Kerry’s recent Scientific Advisory Council meeting in Beloit, USA. At the meeting, our Scientific Advisory Council and Kerry colleagues from around the world came together to discuss pressing issues in nutritional science and how these issues can be addressed through research and innovations in product development. Each blog was written by subject matter experts who attended the meeting.
Other blogs in the series:
Love for Legumes in Dietary Guidance and Product Innovation
Three Things You Need to Know About Protein for Exercise Performance
Red Meat Can Still Be ‘What’s for Dinner’
Why Don’t Athletes in the Olympic Village Shake Hands?
Empty calories, such as added sugars, have been the focus of increasing attention in dietary guidelines in recent years due to their association with poor dietary quality and negative health outcomes. Often accompanying dietary guidance are changes in policy that can impact the way food companies formulate their products or label food packages. In May 2016, the United States Food and Drug Administration (USFDA) finalised requirements for the new Nutrition Facts Panel for packaged foods and specified that added sugars must be included in the nutrition panel on food packages, expressed in grams and as percent Daily Value (USFDA, 2016). Furthermore, several countries either have already introduced or are in the process of introducing some form of sugar tax, although there is no conclusive evidence showing that such a policy can improve dietary behaviour.
The update to the Nutrition Facts Panel brings several changes to what must be labelled on a food package. For more details, check out our article FDA Modernizes Nutrition Facts Label for Packaged Foods.
These regulations have generated a lot of debate among the scientific community as to whether a reduction in added sugar intake would improve the health status of the population. However, with added sugar firmly in the crosshairs of public health policy, the food industry is left to define the added sugar content of their products, leading to the question – what are added sugars?
What are Added Sugars?
Although there is no clear-cut definition for the term ‘added sugars’ or a standardized analytical method to quantify added sugar content of a food, the US Dietary Guidelines Advisory Committee (DGAC) described added sugars as “sugars that are either added during the processing of foods, or are packaged as such, and include sugars (free, mono- and disaccharides), syrups, naturally occurring sugars that are isolated from a whole food and concentrated so that sugar s the primary component (e.g., fruit juice concentrates), and other caloric sweeteners” (USDA, 2015 & 2016). Examples of added sugars can be seen in Table 1. Added sugars can be found in many types of food and beverages such as soft drinks, breads, cakes, jams, chocolates, and ice cream, as well as sugars eaten separately or added to foods at the table.

Table 1. Examples of added sugars that can appear on ingredient labels (USDA, 2016)
It’s important to note that added sugars do not include sugars naturally present in foods such as lactose in milk or fructose in fruit. However, naturally occurring sugars such as lactose are classified as added sugars if they are used as an added ingredient during food production. For example, the sugar in 100% fruit juice would not be considered added sugar when consumed as a juice. However, if the juice were added to another product to provide sweetness, the sugar from the juice would then be considered added sugar. The confusion around what ingredients are considered added sugar is compounded by the fact that the “added” component is a value that must be calculated rather than something that can be directly measured in a product. Complying with added sugar labelling will prove a challenging task for the food industry in the coming months and years.
Added Sugars in the Diet
For the first time ever, the US DGAC has provided a quantitative number for the reduction of added sugars in the diet. They recommend that individuals should limit their calorie intake from added sugars to less than 10% of total calorie intake on a daily basis (USDA, 2015), which is in agreement with guidelines from the World Health Organisation (WHO, 2015). In terms of grams, an individual who has a total daily energy intake of 2000 kcal should get no more than 200 kcal (50 grams) from added sugars. To put this in perspective, one can of cola contains around 40 grams of added sugar. This means that complying with these added sugar policies could also be a great challenge for the consumer!
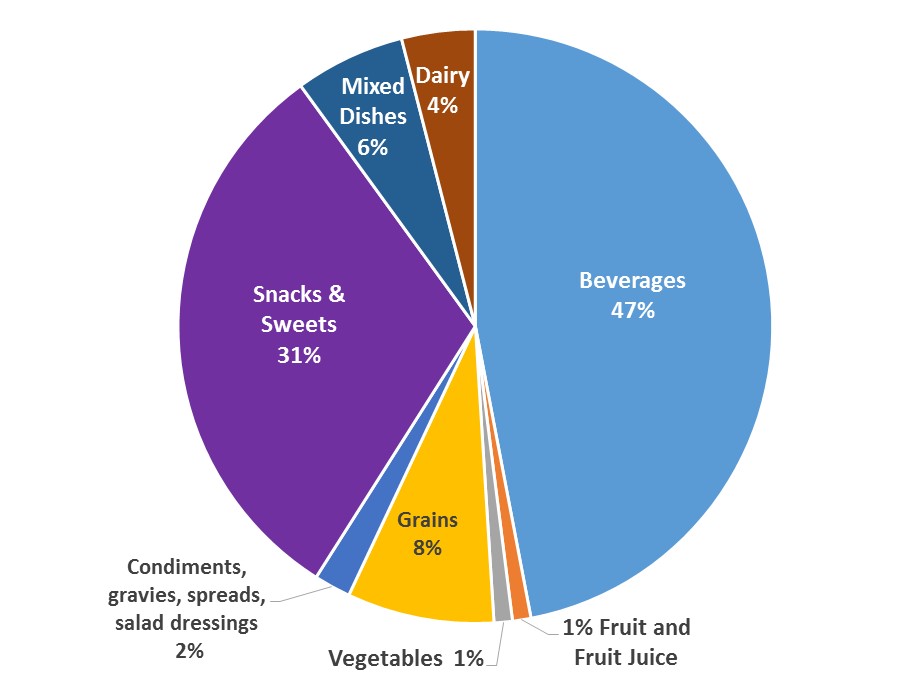
Current daily consumption of added sugars is on average 13% of total energy intake among adults and 16% among children (Ervin & Ogden 2013; Erickson & Slavin 2015). The major dietary sources of added sugars are beverages (47%) as well as snacks and sweets (31%) (Figure 1, USDA 2015). Within beverages, soft drinks were the highest contributor (25%). Within snacks and sweets, the main food sources of added sugar were dairy desserts, grain-based desserts, candies, sugars, jams, syrups, and sweet toppings.
Figure 1. Food Sources of Added Sugars in the US Diet (USDA, 2012).
The 2015-2020 Dietary Guidelines for Americans states that consuming limited amounts of added sugars in products such as wholegrain breakfast cereals or fat-free yogurt is acceptable as long as the threshold of 10% total daily energy intake is not exceeded (USDHHS & USDA, 2015).
Moving Forward
Consumers
Since 78% of added sugars in the diet come from beverages, snacks and sweets, recommendations focus on changing how often these products are consumed as well as on how they are produced. Dietary Guidelines for Americans suggest consumers should choose beverages with no/low added sugars, reduce portion sizes of sugar-sweetened beverages, and limit how often such beverages are consumed. Additional advice includes limiting or decreasing portion sizes of grain-based and dairy desserts and sweet snacks, choosing unsweetened/no-added-sugar versions of canned fruit and yogurt (USDA, 2015).
See our Sources for National and Regional Dietary Guidelines for added sugar recommendations by region.
Food Industry
Added sugars not only contribute to flavour but also to food preservation and functional attributes including texture enhancement, viscosity, and improved appearance (Erickson & Slavin, 2015). Therefore, removing or reducing added sugars will have a significant impact on food production and presents a major challenge to food manufacturers. Taste is the key factor for the purchase and re-purchasing of food products by consumers, so even if manufacturers are able to successfully reduce sugar content, the final product must still taste good. Successful alternatives to added sugars in food products would not only be highly desirable to consumers but would also encourage reduced added sugar intake.
A major limitation is that low calorie sweeteners are not considered an appropriate alternative to added sugars in foods and beverages by the DGAC due to uncertainty surrounding their long-term effects (Erickson & Slavin, 2015). One successful method for reducing sugars without affecting taste is the application of flavour modulation tools. These technologies can enhance our sensory perception of flavours like sweetness without requiring more sugar to be added to a product. By using this technique, overall taste perception and flavour profiles are improved, thereby producing healthier products, while maintaining consumer preferred taste.
The USFDA ruling on the new Nutrition Facts Panel has two deadlines of compliance for manufacturers: July 26, 2018 for food manufacturers with annual sales greater than $10 million and July 26, 2019 for manufacturers who have less than $10 million in annual sales (USFDA, 2016).